what we offer
Every day we collect endless amounts of data, so much so that processing all of it can become overwhelming. Happy Data specializes in custom integrations, analysis, and visualizations that will help you make sense of your data.
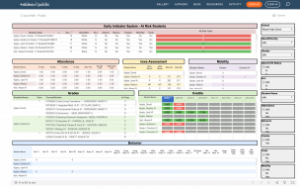
tableau visualisation example
This school district wanted to see which of their students fall into certain “At Risk” categories. For this school district, a student who is at risk in two or more of five categories is considered an “At Risk” Student. The categories are: Attendance, Behavior, Test Scores, Grades, Credits, and Mobility. In each category, the district has a specific set of criteria for which a student would qualify as at risk. For example, a student who has changed schools three times in one year or six times their entire career would be considered At Risk in the “Mobility” category. Two or more “Level 2” behavior referrals per month would earn a student an “At Risk” mark in the “Behavior” category.
The first step of this project was to translate the district’s logic into a stored procedure that outputs the data required for this visualization. I then scheduled this stored procedure to run nightly after the district’s Data Warehouse Refresh process completes, creating the table on their Data Warehouse database. After these items were completed, I created the Tableau visualization, allowing the district to view their “At Risk” students by school, gender, race/ethnicity, and at risk category.

about me
Data specialist at your service with over fifteen years experience designing creative and useful solutions in various industries from museums to schools to hospitals
Leveraging the power of Tableau & SSRS to give school districts a deeper knowledge of their staff and students from the forest on down to the trees. Answering questions such as the implications of re-zoning school boundaries and “how many math teachers will we need next year” helping teachers see trends in student attendance / behavior / grades so they can better serve the kiddos in their classroom
Hospitals generate overwhelming amounts of data. Teaming up with the visionary hospital analytics gurus (CareSight), I help to extract and combine millions of data points from disparate sources into a cohesive platform; “cleaning”, analyzing and creating digestible stories for clients to better understand the movements of their nurses and the needs of their patients.
Ultimately, questions are asked and answered leading to process adjustments which create leaner, more efficient workflows and better-performing hospitals.
What stories does your data tell?
contact me


